 When it comes to free analytics software, nothing comes close to Google Analytics.
Over 28,365,107 sites use it, which makes it the most popular analytics solution on the market.
Although it has some limitations, it’s fantastic as a free product.
However, most webmasters see the basic graphs and stats that Google Analytics (GA) gives you and never dig any deeper.
This is a shame because there are some really useful advanced features just waiting for you to be used. And I’m about to show you what they are.
And
although they’re advanced, they aren’t complicated to implement or use.
I’m going to break them down step by step in this post, and I encourage
you to start using as many of them as you find useful.
1. One Goal is Nice, but Two is Better
Too many website owners focus mostly on traffic.
It doesn’t matter how many people you can get to visit your site if you can’t convince many to subscribe or buy from you.
As
a marketer, you can do many things to try to improve your conversion
rates. But they all require tracking your conversions to see if you were
able to produce a statistically significant improvement.
In GA, conversions are called “goals.” Goals are specific actions that visitors take on your website that you’d like to track.
Setting up a basic goal: Goals
are limited because you can track only a few specific options. If you
need more customized options (e.g., clicking a specific link), I’ll show
you how to do that with another trick later on.
What goals are typically best for is to track when a visitor loads a specific, exclusive page, like a thank-you page after signing up for an email newsletter.
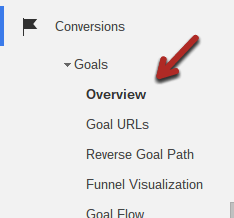
To start, go to the “Conversions > Goals > Overview” tab at the very bottom of the left-hand menu:
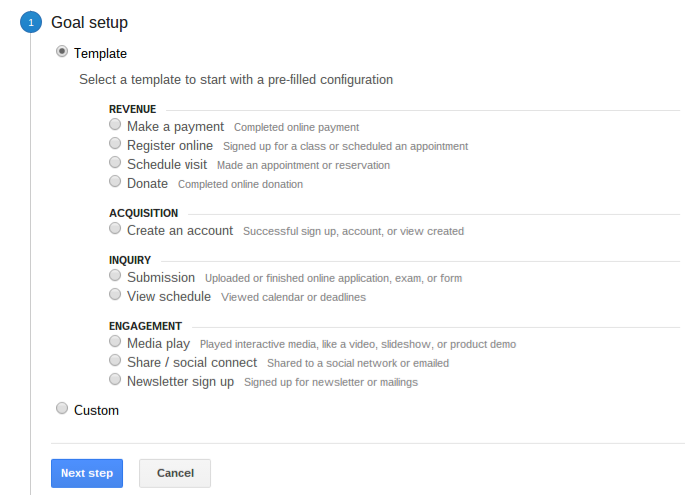
Next,
you can choose which pre-filled template you’d like to use. This will
narrow down the fields you need to fill out in the final steps:
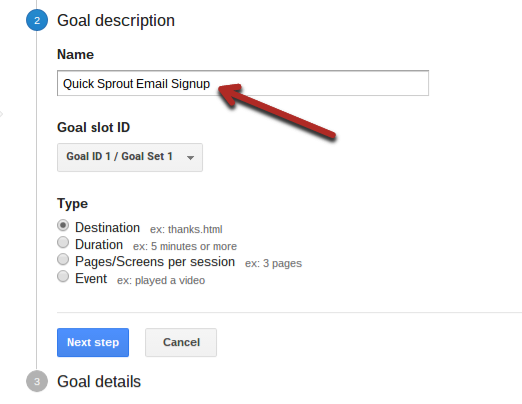
Once
you click “Next Step”, you’ll get a chance to give your goal a name.
This will show up later in your analytics, so pick something that is
descriptive.
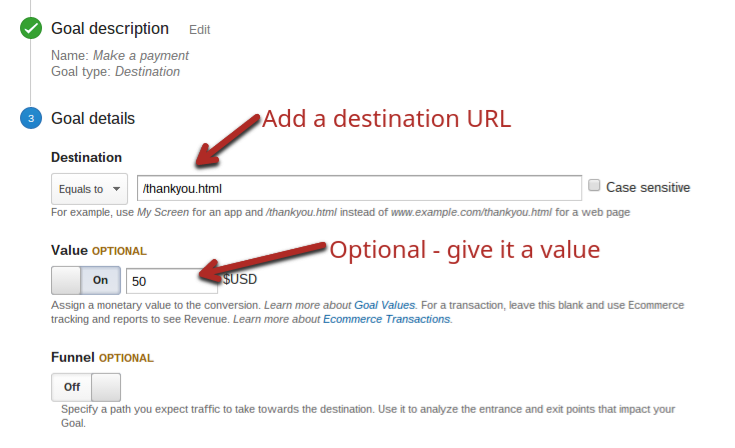
One last step is to put in the page or metric you’d like tracked.
In
this case, it’s a URL of a thank-you page that visitors can access only
after signing up to a newsletter (it automatically redirects them to
it).
You can also add a value for the goal. If a subscriber is
worth $50 (hypothetically), you can type that in. It will show up in
your tracking later on, and you can use it as a quick estimate of your
income over a time period.
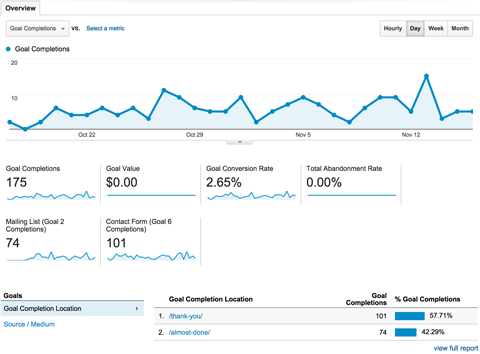
Once you click “Create Goal”, you’re done.
You won’t have any data at the start, but after a few days, you’ll see a graph like this:
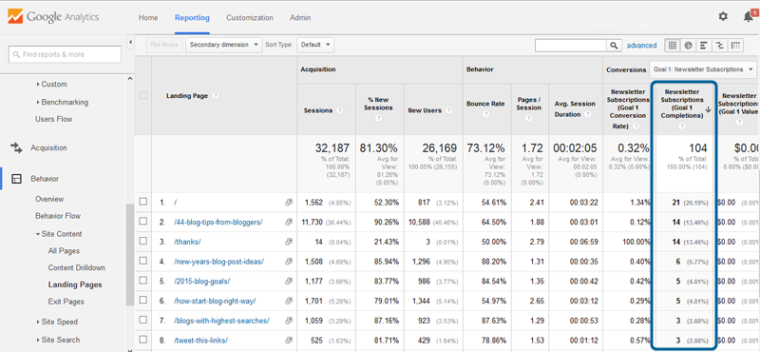
In
addition, you can go to almost any report in GA and see a column for
your goal. For example, you can see how well traffic converts based on
its landing page:
Take conversions further by setting up multiple goal tracking: What do you do when you want to track a specific goal, but there are multiple ways for a visitor to accomplish it?
For
example, you may have different email lists that users can join, so
they have separate thank-you pages tailored for each specific list.
You could create
two separate goals, but in many cases, you’ll want to combine them into
a single “email signup” goal. It’s pretty simple to do.
Create
your goal just like you normally would (above), but when you get to the
final step, choose “regular expression” instead of “equals to.”
This allows you to use regular expression statements to create a goal that matches multiple pages.
For example, if I had two destination pages after a user signs up:
- /thank-you.html
- /download
I would enter:
/(thank-you.html|download)$
As shown below:
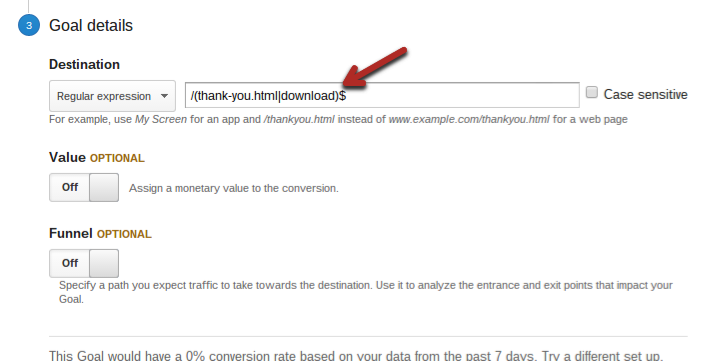
If
you’re not familiar with regular expressions, the vertical line (“|”)
represents an OR statement. Essentially, it’s saying that if the URL
matches a value on either side of the line, it should count as a goal.
The brackets are needed to identify where the different options start
and end.
Finally, the dollar sign signifies the end of the regular
expression. In this case, it wouldn’t matter, but if you had multiple
URLs that contained “/download”, you would use it to avoid counting
other pages as well.
2. Understand Your Effectiveness with Event Tracking
Readers click on a lot of things when they visit your website.
One way to track their actions is with heat mapping software, but GA also has a few useful features.
An event is typically a click.
With
event tracking, you can track how often readers are clicking a specific
link or element. Most commonly, it is used to track:
- file downloads
- link clicks
- embedded AJAX page elements interactions
- Flash movie (or element) plays
This is useful to see if visitors are actually clicking on a specific link or element that you add to a page.
The good news is it’s relatively simple to do once you understand it.
Here’s what the basic form of event tracking code looks like:
_trackEvent(category, action, opt_label, opt_value, opt_noninteraction)
That’s going to mean absolutely nothing until I define the terms in brackets there:
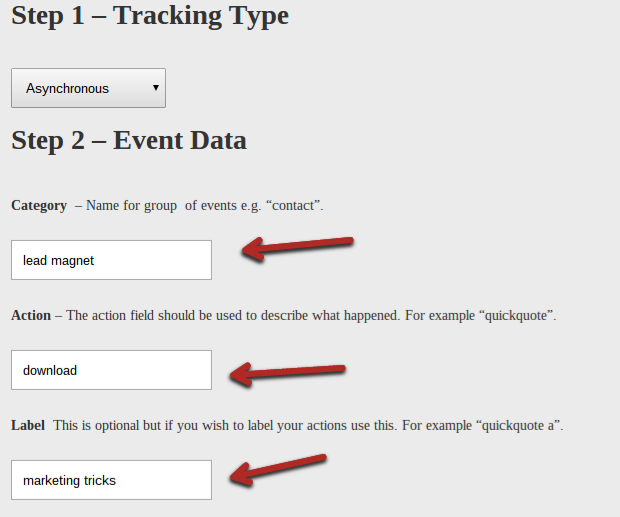
- category – the type of event you are clicking. This label is mandatory, but you can call it anything. Examples include “bonus file,” “video,” and “affiliate links.”
- action – this is also mandatory. You need to specify a type of action that describes the event. Typically it will be something like “click” or “download.”
- opt_label – another label you can use to describe the event—optional.
- opt_value – how much you think this action is worth. Don’t include currency symbols: e.g., enter “5” for $5. This is an optional field.
- opt_noninteraction – if someone completes this event, you need to decide if you’d like it to affect the page’s bounce rate. If you do want it to affect it, enter “False”, otherwise, enter “True.”
Let’s pretend I had a bonus PDF of my best marketing tricks available for download. My event tracking code would look like this:
_trackEvent(‘lead magnet’, ‘download’, ‘marketing tricks’, 5, True)
But,
this code by itself is useless. What you need to do is add it to an
“onClick” property in a link’s URL. Unfortunately, there are some slight
syntax differences, so you can’t just copy and paste.
I need to find the link to the PDF download and add the code:
Make this easy with a code generator: If you’re not a huge fan of the technical stuff or having trouble remembering how to format the code correctly, you can use a GA event tracking code generator.
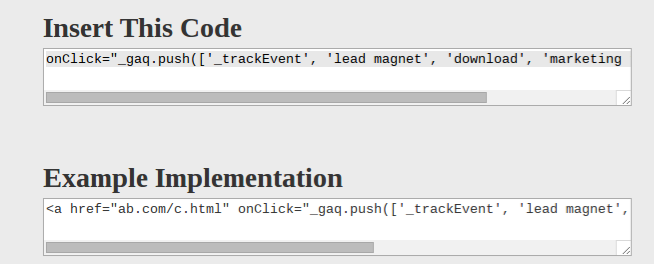
Just enter in the variables I explained above, and it will spit out the onClick code you can copy and paste into a link:
Once you’ve filled out the fields, you’ll get something like this:
3. Get a Visual Look into Your Visitors’ Actions with In-Page Analytics
What if you could see exactly what your visitors were doing on your pages?
That’d be pretty useful.
You’d be able to see what parts of the content attracted their
attention and which parts they didn’t really care for. You could use
that information to optimize the user experience, which would lead to
better conversions and more sales.
Well, that’s exactly what a heatmap software such as Crazy Egg does.
While it isn’t that
expensive, I know that some website owners want to start with a more
basic solution that doesn’t cost them anything. That solution is GA’s
in-page analytics.
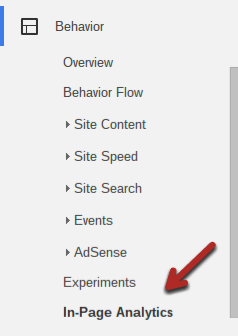
Option #1 – Use GA’s native in-page analytics: Start by navigating to “Behavior > In-Page Analytics”:
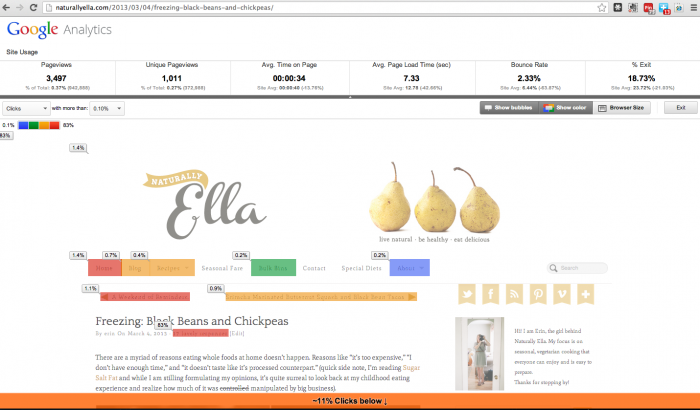
By
default, it will show you your homepage with basic page metrics
(pageviews, time on page, etc.), as well as bubbles over all the links.
The bubbles show you the click-through rate for each destination URL
(clicks divided by page views).

Pay close attention
to what I just said there. The click-through rate is for each
destination page. So, if you have four links to your contact page, they
will all show the exact same percentage even though they probably got a
different number of clicks. This is one of the main limitations of this
feature.
You can explore other modes here. At the top right of the window, you can select “show color” or “browser size”:

The
color option will highlight all the different links on the page, with
the most clicked ones turning red and the least clicked ones turning
blue. It’s the same information, just presented visually.
No comments :
Post a Comment